
(PHOTO CREDIT: "Mid-level Solar Flare" by NASA Goddard Photo and Video / "Earth - Global Elevation Model with Satellite Imagery (Version 3)" by Kevin M. Gill )
Social sentiment is a cardinal indicator of future sales performance, leading metrics such as social media posts, news, videos, and online interactions on social media to become more commonplace in decision making at major corporations and within vesting workflows.
Social intelligence offered by this subset of alternative data can be combined with observational awareness of weather patterns to amp alpha and profit mightily in today’s chaotic times.
J.P. Morgan once famously said that millionaires don't need astrologers, but billionaires do. This quite possibly may have been a nod to the life work of Alexander Tchijevsky, who authored the paper “Physical Factors of the Historical Process,” a seminal evaluation of major historical events establishing a concentration in their occurrence around solar maxims.
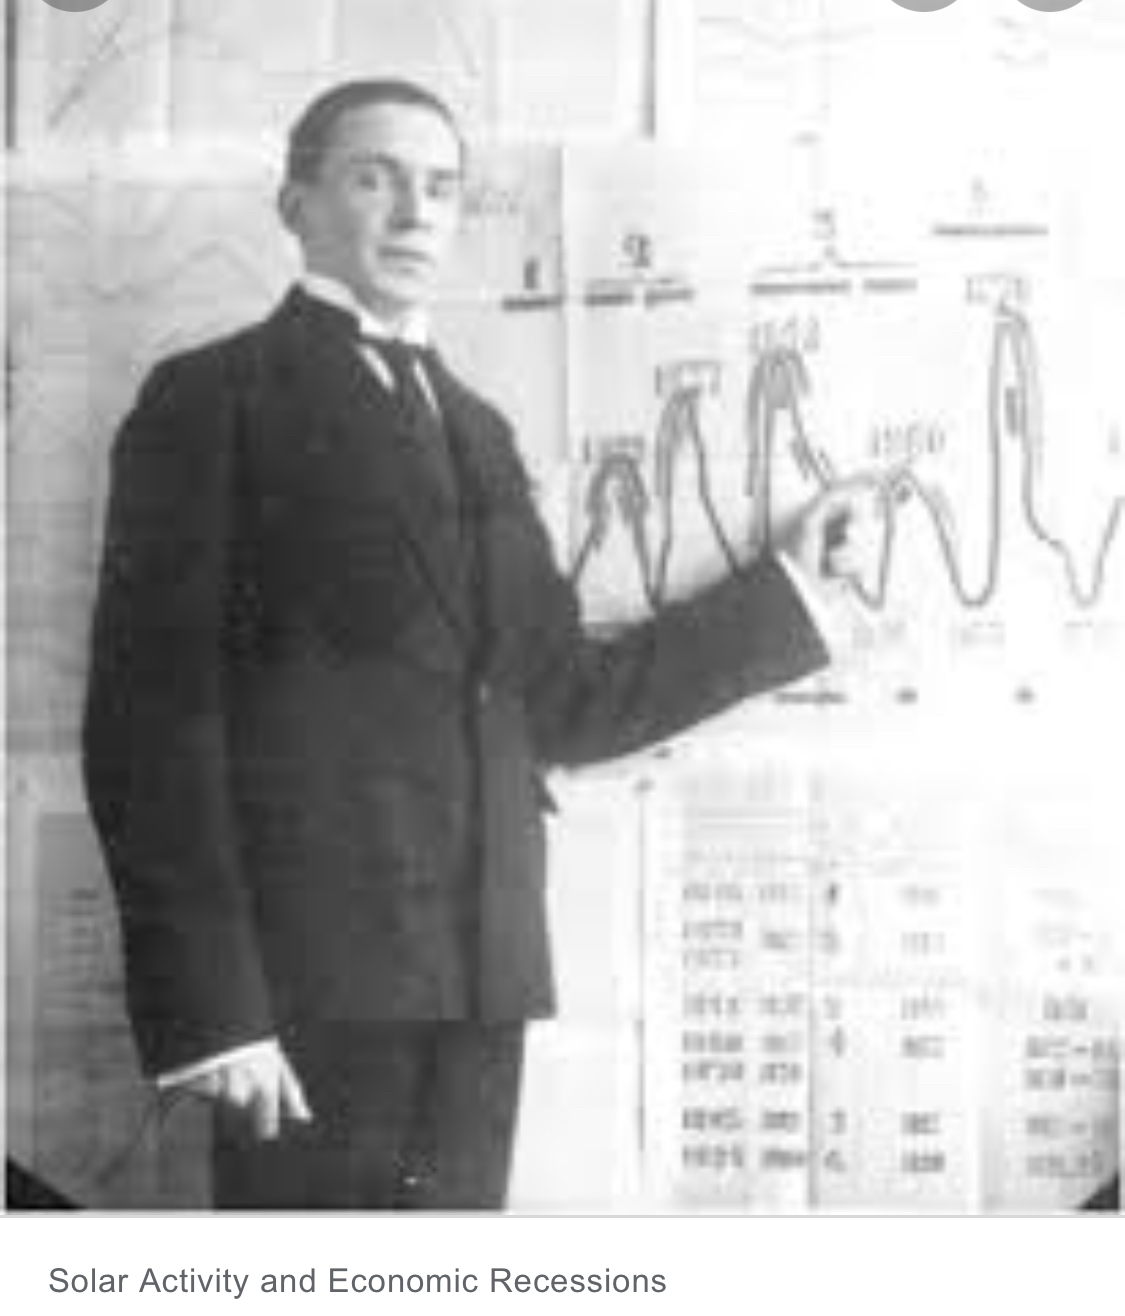
The data charted historically notable activities across 72 countries from 500 BC to 1922, culminating in Tchijevsky’s detection of four perennial cycles associated to oscillations in “Mass Human Excitability.” These delineated, with cyclical accuracy, periods of revolution and rest, with implications for business related to governmental activity.
Although largely ignored by financial and mainstream media, it is worth taking the time to understand how geomagnetic and lunar phasing impacts on human psychology link to behaviors that inform consumer financial decisions germane to forming a holistic picture of market movement.
According to John Hampsten’s 2012 financial analysis report, Trading the Sun, “in the last 150 years there have been several papers published demonstrating correlations between natural phenomena and the financial markets and the macro economy.”
A summary of notable contributions, aggregated and cited by Hampsten:
Garcia-Mata and Shaffner conclude a clear statistical correlation between the major cycles of non-agricultural business activity in the U.S. and the solar cycle. Business cycles were related to sunspot activity affecting output and prices. (1934)
Based on 93 years of data, Charles Collins finds a major stock market top is due when the average yearly number of sunspots rises to over fifty. (1965)
Forty three activities, including commodity prices, stock prices, banking activity, business activity, industrial production and agricultural productivity, are discovered by Edward Dewey to fluctuate with the sun’s 11 year cycle. (1968)
Bryan Walsh pens a Cycles Magazine article combining computations of the rate of change in the geomagnetic field over the years (using the Ap index) together with the annual rates of for several measures of economic and financial performance (GNP, CPI, stock prices, gold price, bonds), to evidence the former led the latter by 6 to 12 months with an average 65% correlation. (1993)
The responsiveness of stock market returns to the sun’s illumination of the moon yielded recognition of the following patterns:
One hundred years of data reveals that stock returns in the 15 days around a new moon were around double those in the 15 days around full moons, for all major US stock indexes, and nearly all stock indexes of 24 other countries studied over a thirty year period by Illia Dichev and Troy Janes. (2001)
Factoring out volatility, volume, and other calendar related phenomena, K Yuan, L Zheng and Q Zhu find that returns are lower around full moons and higher around new moons by 3-5% per annum in a stock market return study spanning 48 countries. (2002)
Researching ten years of data, Marco Hickey identifies a positive correlation between five US stock indexes and returns around new moons, and the inverse for the 10 year bond. (2009)
There is a growing record of biological and psychological evidence that geomagnetic field changes and sunspot maxima affect biological systems, with the sun’s illumination of the moon impacting human mood and behavior.
One meaningful collection of inputs was published in 2011, comprised of researcher William Hrushesky’s observations that for several months following the occurrence of a solar sunspot maximum, humans exhibited elevations in oral temperature, pulse rate, blood pressure, and respiration rate accompanied a slight tapering of man’s maximum expiratory flow succeeding its peak.
Accounting for these financial and biometric indicators in economic, industry, and company analyses can lend great insight to seasonal pricing, portfolio optimization, risk management, and trading strategy when real-time solar phenomena stats are incorporated, considering business and economic trends tend to repeat in cycles underpinned by this data set.
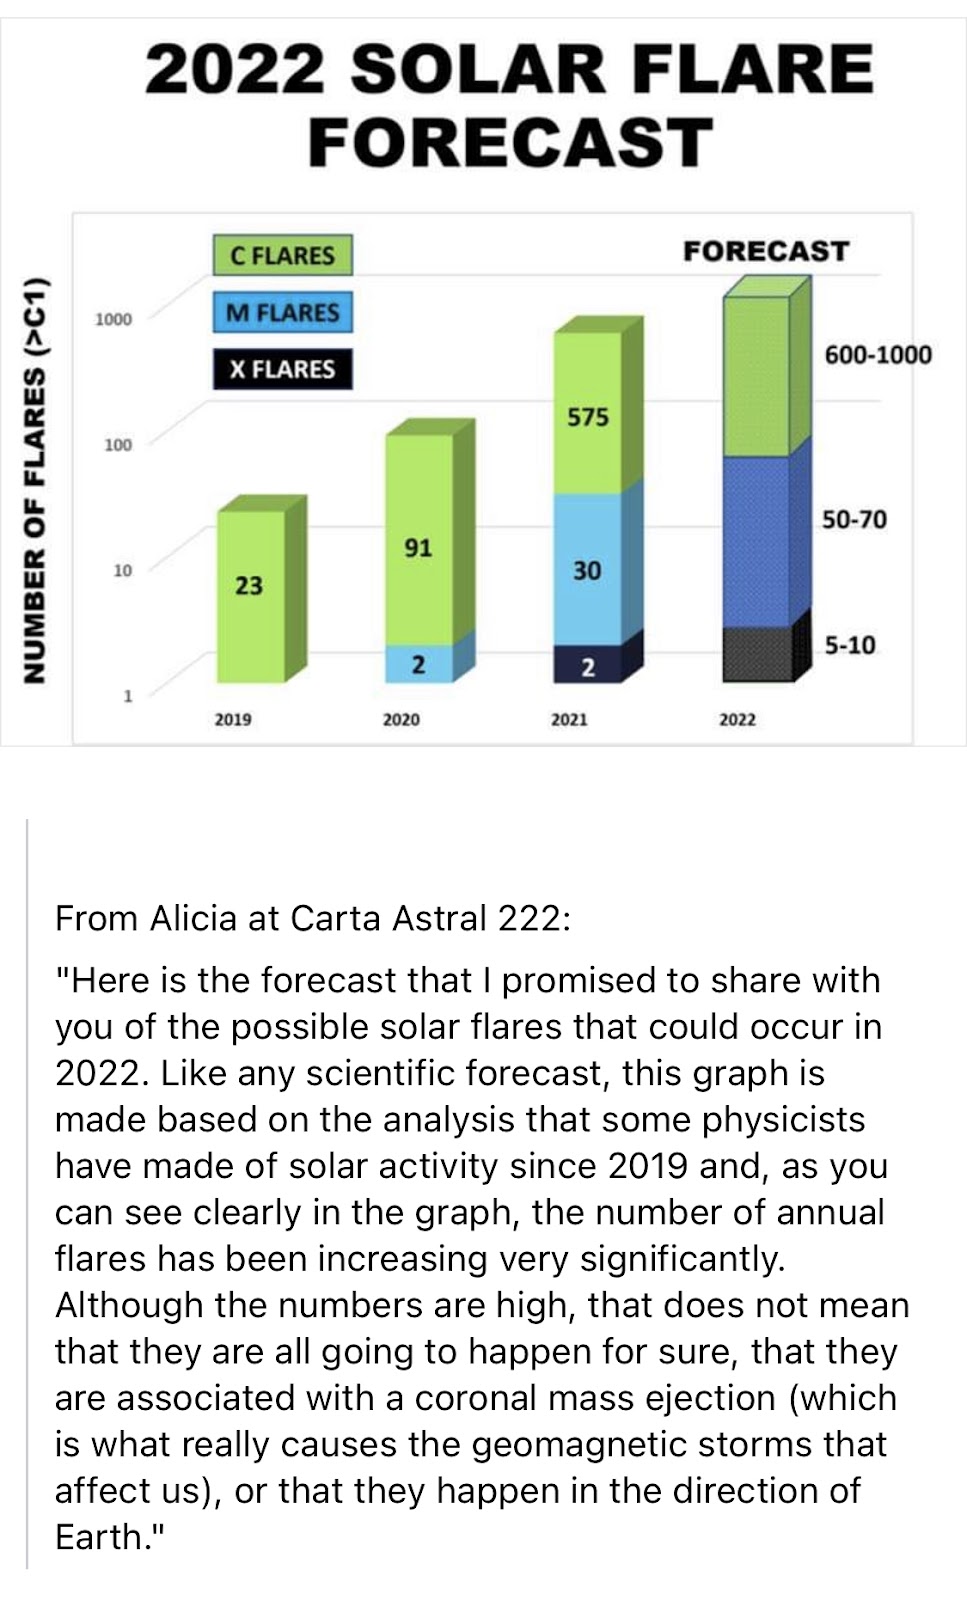
Photonic energy is coming in at a speed we are completely unused to in our lifetime, with solar flare ejections numbering twenty three in 2019, clocking in at nearly one hundred in 2020, and projected to jump to one thousand instances this year according to Astrophysicist Alicia Gonzalez.
(PHOTO CREDIT: Pam Gregory, ‘The Next Step’ Consultancy, United Kingdom )
Starting to understand constant feedback around this electrically charged energy is increasingly fundamental in forming coherent models to assess the temperature of the market, with humans being much more open to cosmic and galactic radiation due to a substantial drop in the density of Earth’s magnetic shield.
Geoclimatic datasets sourcing public spectrometers’ plasma expulsion measurements directly from the sun's corona can assist quants in staying on top of tracking effects of the embedded electromagnetic fields ricocheting to our planet.